Design it clean project:
Product Description
Materials
Sand x2 cups $3.68
2 liter bottle x2 $3.58
Charcoal x1 Bag $2.97
Gravel x1 cup $4.99
Cheese cloth x1 sq ft $2.49
Total: $17.71
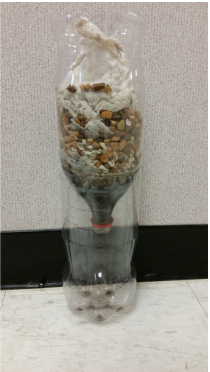
We will cut off the bottom of one bottle and the top of our other 2 liter bottle and combine them so our filtered bottle drips into the empty bottle below it. In the filtered bottle we will put mixed layers of sand and gravel our cheesecloth on the top and in the middle to get out any large pieces of waste, on the bottom of this we will put the crushed charcoal which will remove any sediments or contaminants in the water while also improving taste. In the very bottom of the bottle we will put layers of cheesecloth so that all of the water will pass through the cheesecloth to filter as much as possible.
Test Results:
Turbidity Test: For the turbidity test we filled a graduated cylinder with dirty water and put a rod in the water until we could not see the end of the rod. We then measured that distance. After that we put the dirty water through our filter and then repeated the process to see how much dirt and sediment we were able to remove. For the first test we got 3.25 cm for the dirty water, and 11.5 cm for the filtered water. For the second test we got 1.5 the first time using slightly dirty water and it was 11.25 filtered. For the third and last test, we used extremely dirty water and got .75 for the first test, and 7.5 filtered.
Ammonia Test: For ammonia test we had a test tube with filtered water we added 8 drops 2 types of ammonia type 1 and type 2.The initial (ppm) 4.0 for all 3 tests. Final (ppm) for test 1 was .25 fanal. Test 2
Conductivity Test:
In this test we needed to measure how much salt we could remove from our water to make it safer. First we found how much salt was in tap water, which was 269 grams per centimeter, and salt water which was 10,372 grams per centimeter. We put both of these through our filter and found that the tap water had 370 grams per centimeter, so it added some, but the salt water only had 5,558 grams per centimeter, so it cut it in half. Overall, this shows that our filter works well in highly salted areas, but does not work at all in very limited salt areas.
Filter Time Test:
For this test we measured how long it took water to run through our filter. We did this test three times and the average we got was 2.41 seconds to run the water through our filter which means that people who use our filter will be able to get their water very fast.
Materials
Sand x2 cups $3.68
2 liter bottle x2 $3.58
Charcoal x1 Bag $2.97
Gravel x1 cup $4.99
Cheese cloth x1 sq ft $2.49
Total: $17.71
We will cut off the bottom of one bottle and the top of our other 2 liter bottle and combine them so our filtered bottle drips into the empty bottle below it. In the filtered bottle we will put mixed layers of sand and gravel our cheesecloth on the top and in the middle to get out any large pieces of waste, on the bottom of this we will put the crushed charcoal which will remove any sediments or contaminants in the water while also improving taste. In the very bottom of the bottle we will put layers of cheesecloth so that all of the water will pass through the cheesecloth to filter as much as possible.
Test Results:
Turbidity Test: For the turbidity test we filled a graduated cylinder with dirty water and put a rod in the water until we could not see the end of the rod. We then measured that distance. After that we put the dirty water through our filter and then repeated the process to see how much dirt and sediment we were able to remove. For the first test we got 3.25 cm for the dirty water, and 11.5 cm for the filtered water. For the second test we got 1.5 the first time using slightly dirty water and it was 11.25 filtered. For the third and last test, we used extremely dirty water and got .75 for the first test, and 7.5 filtered.
Ammonia Test: For ammonia test we had a test tube with filtered water we added 8 drops 2 types of ammonia type 1 and type 2.The initial (ppm) 4.0 for all 3 tests. Final (ppm) for test 1 was .25 fanal. Test 2
Conductivity Test:
In this test we needed to measure how much salt we could remove from our water to make it safer. First we found how much salt was in tap water, which was 269 grams per centimeter, and salt water which was 10,372 grams per centimeter. We put both of these through our filter and found that the tap water had 370 grams per centimeter, so it added some, but the salt water only had 5,558 grams per centimeter, so it cut it in half. Overall, this shows that our filter works well in highly salted areas, but does not work at all in very limited salt areas.
Filter Time Test:
For this test we measured how long it took water to run through our filter. We did this test three times and the average we got was 2.41 seconds to run the water through our filter which means that people who use our filter will be able to get their water very fast.
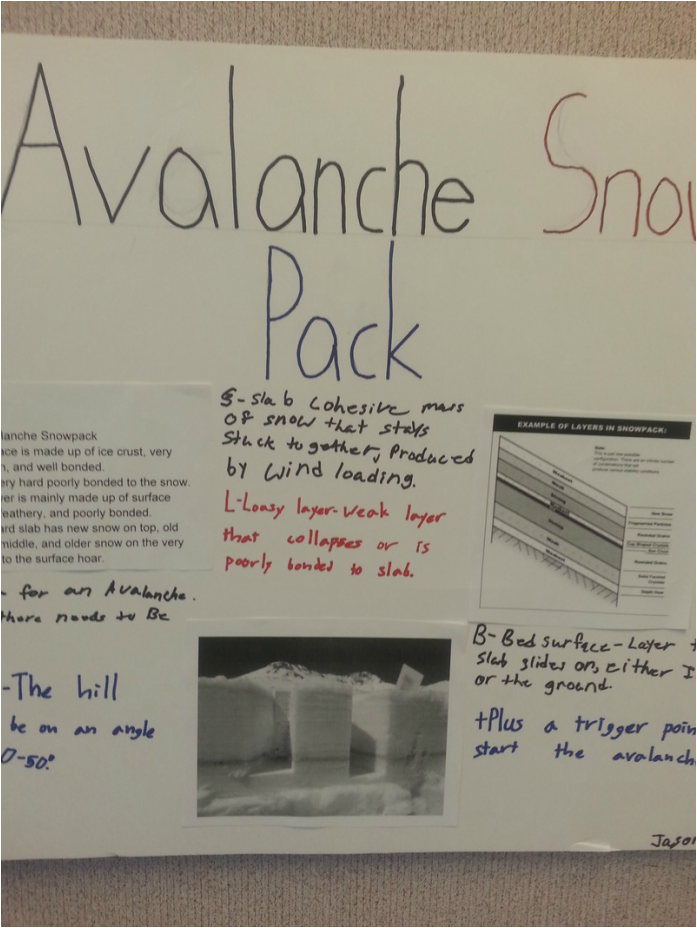
Snow project poster:
Rocket Project
Introduction
‘Our water rockets that my group used were constructed of two 2 liter bottles. One was used to hold water and all of the PSI the other was used as a nose cone. Although they were the same sized bottles they were not the same shape. Our `variable that we had to test was the shape of the bottle. We thought that if the bottle shape was different then it would affect the height of the rocket. We then came up with a hypothesis which was if body shape affects height then we will determine what shape is more successful depending on how high it goes.
Procedure
Our variable for this project was body shape. How we went about testing this variable is that each member of our group used a different shaped bottle. We all used 2 liter bottles with different body forms and different ways of construction.
Constant Variables
Amount of water
PSI in the bottle
Weight
Location
A variable that we were unable to keep constant was weather.
Data
Rocket
Angle
Distance
Hang Time
Height
Marks
52
16
2.57
20.47
Ryans
60
16
3
28.7
Jasons
39
16
2.01
11.62
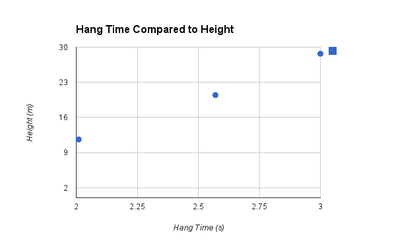
We collected our data by having one member of our group stand a certain distance away from the launch pad and measure how high the rocket went, while another group member timed how long our rocket would take to reach maximum height. We then graphed our rocket by putting our data in the same way as in the sheet.
Conclusion
Our hypothesis was If body shape affects height then the rocket that is more streamline will go higher because turbulence will be minimized. Our results after testing this were inconclusive. We did not undergo enough tests with the two different types of rockets to prove our hypothesis. One of our errors in this project was not doing enough tests to prove our hypothesis. We were also inconsistent with many of our rocket launches with things like weight, PSI and water volume. After applying all of those things to all of our rockets to make them similar as possible our rockets and tests improved. A recommendation I have for future students is to make sure you have all of your variables and process determined before building and testing your rockets.
Introduction
‘Our water rockets that my group used were constructed of two 2 liter bottles. One was used to hold water and all of the PSI the other was used as a nose cone. Although they were the same sized bottles they were not the same shape. Our `variable that we had to test was the shape of the bottle. We thought that if the bottle shape was different then it would affect the height of the rocket. We then came up with a hypothesis which was if body shape affects height then we will determine what shape is more successful depending on how high it goes.
Procedure
Our variable for this project was body shape. How we went about testing this variable is that each member of our group used a different shaped bottle. We all used 2 liter bottles with different body forms and different ways of construction.
Constant Variables
Amount of water
PSI in the bottle
Weight
Location
A variable that we were unable to keep constant was weather.
Data
Rocket
Angle
Distance
Hang Time
Height
Marks
52
16
2.57
20.47
Ryans
60
16
3
28.7
Jasons
39
16
2.01
11.62
We collected our data by having one member of our group stand a certain distance away from the launch pad and measure how high the rocket went, while another group member timed how long our rocket would take to reach maximum height. We then graphed our rocket by putting our data in the same way as in the sheet.
Conclusion
Our hypothesis was If body shape affects height then the rocket that is more streamline will go higher because turbulence will be minimized. Our results after testing this were inconclusive. We did not undergo enough tests with the two different types of rockets to prove our hypothesis. One of our errors in this project was not doing enough tests to prove our hypothesis. We were also inconsistent with many of our rocket launches with things like weight, PSI and water volume. After applying all of those things to all of our rockets to make them similar as possible our rockets and tests improved. A recommendation I have for future students is to make sure you have all of your variables and process determined before building and testing your rockets.
